Geobits Ν°5: The map revealing where climate change is threatening food production
GeoBits | Small News, Big Insights from the World of Geospatial Data
What’s happening in the world of geospatial technologies?
With GeoBits, we bring you the most important developments in GIS, geoinformatics, and geospatial data every month—concise, relevant, and packed with practical value.
Check out today’s GeoBit and share your thoughts in the comments.
GeoNews | The map revealing where climate change is threatening food production
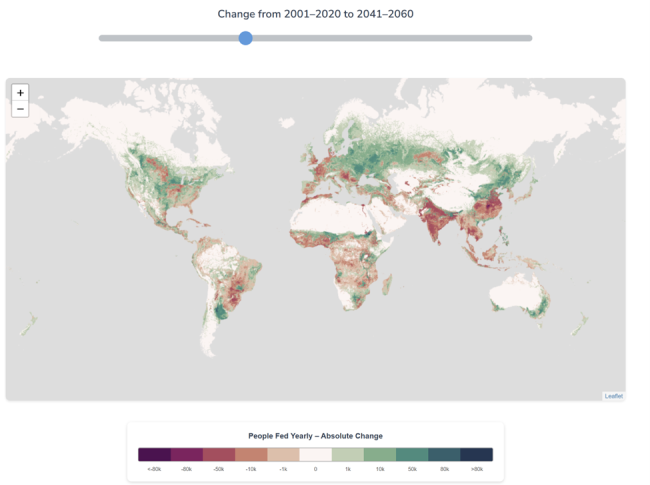
Can a map show us today which regions are likely to face increasing difficulty in producing food?
Researchers at the Institute of Economic Analysis of the Spanish National Research Council—CSIC—have developed the Climate-Driven Agricultural Decline Index (CADI), an interactive platform that maps the impact of climate change on the potential productivity of agricultural land worldwide, at a spatial resolution of approximately 10 × 10 kilometres and with projections extending to 2100.
The model keeps the crops and agricultural practices recorded in 2020 unchanged, while varying only the climatic conditions. This makes it possible to isolate the impact of climate change from the effects of human decisions and adaptation measures.
The findings on changes already observed are particularly concerning:
- Approximately 16% of cultivated land worldwide has already lost more than 10% of its potential productivity.
- 15% of the global population currently lives in areas where agricultural potential has declined by at least 5%.
- Under a medium-to-high warming scenario, this proportion could rise to 49% of the global population between 2041 and 2060.
The most significant losses are being recorded in the northern countries of the European continent. By contrast, some higher-latitude areas, including Scandinavia, Scotland and the Alps, are experiencing increases in potential productivity. However, these gains start from very low production levels and therefore translate into only a limited increase in the actual number.
The value of CADI extends beyond forecasting. The platform can also serve as an early planning tool, helping identify where the following measures may be needed:
• changes in crops and agricultural practices
• the adoption of new technologies
• the relocation of production to more suitable areas
• the targeted allocation of resources to the most vulnerable communities
The geospatial dimension
CADI is a clear example of how geospatial data, satellite observation, climate models and interactive mapping can be combined to transform complex scientific data into actionable information for planning and decision-making.
At Consortis Geospatial, we closely follow international developments that highlight the contribution of GIS and Earth Observation to understanding environmental change and developing more effective climate adaptation strategies.
Sources: CADI–CSIC and Euronews Earth, July 2026.
#GeoNews #ConsortisGeospatial #GIS #EarthObservation #ClimateChange #Agriculture #FoodSecurity